Monitoring Platform
Black box, monitoring system, and observability
A distributed system contains multiple physically separate nodes linked together by a network. Such systems are inherently difficult to monitor as they are composed of “block-box” components: nodes from different, even competing providers. In such an environment, how to quickly debug, track service processing time, identify performance bottlenecks, and reasonably evaluate service capacity are the major challenges. Monitoring platform plays a crucial role in system feedback, without which improvement is impossible.
Axon is built on a peer-to-peer network. It's real-time monitoring system is composed of components that collect logs, metrics, and system resource usage data from the nodes and display the information in graphs in Grafana, the data visualization platform. This article aims to give you an overview of the architecture of Axon monitoring system and the key components (II), the deployment of the monitoring platform (III), and how to read these metrics (IV). Sections III and IV include technical details and parameters that will be particularly informative for DevOps; if these technical details are not your focus, feel free to skip.
Before diving into the technical details, let's refresh ourselves about the concept of “observability". When introduced in response to the black box problems in distributed systems, observability refers to the ability to measure the internal states of a system by examining its outputs. While traditional monitoring and alerting are focusing on system anomalies and failures, observability is about showing the actual behavior of the system itself. For an observable system, the primary concern is the state of the application itself, such as the current throughput and latency, instead of the indirect evidences like the machine or the network where the application is situated.
Logs, metrics, and traces are seen as three pillars of observability.
Logs
Logs are primarily used for recording discrete, time-stamped events. Applications output log messages in a specific format to a file, then use a logging program to aggregate the logs for analysis. Mature solutions, such as ELK Stack and Grafana Loki, are available on the market.
Despite being comprehensive and information-rich, log files eat up a lot of storage space. Although all the log events can be concatenated by timestamps, it is difficult to demonstrate their comprehensive mapping relationships.
Metrics
Metrics are mainly aggregated data measured over intervals of time. It is suited to measurable data, such as the number of calls, CPU, usage, and query size. Compared to logs, metrics take up much less storage space. Monitoring and alerting are the main uses of metrics, which Prometheus has established as the de facto standard.
Traces
A trace is a series of causally related distributed events, providing a wider and continuous view of an application. Tracing follows a program’s data progression path through a system. A trace contains one or more span(s), the logical unit of work named by Jaeger. Each span includes the operation name, start time, and duration. Tracing adds critical visibility into the health of an application end-to-end, which is helpful for getting a better understanding of system behavior, debugging and troubleshooting issues related to performance.
Implement a monitoring system basically follows these steps:
- Setup event tracking
- Output formatted logs
- Collect metrics and logs
- Display data in graphing interface
- Establish response to early warnings
Axon’s Monitoring Platform
Axon's monitoring platform contains Agent (Axon node), monitor server, and monitor dashboard. The diagram below illustrates these components and their interactions:
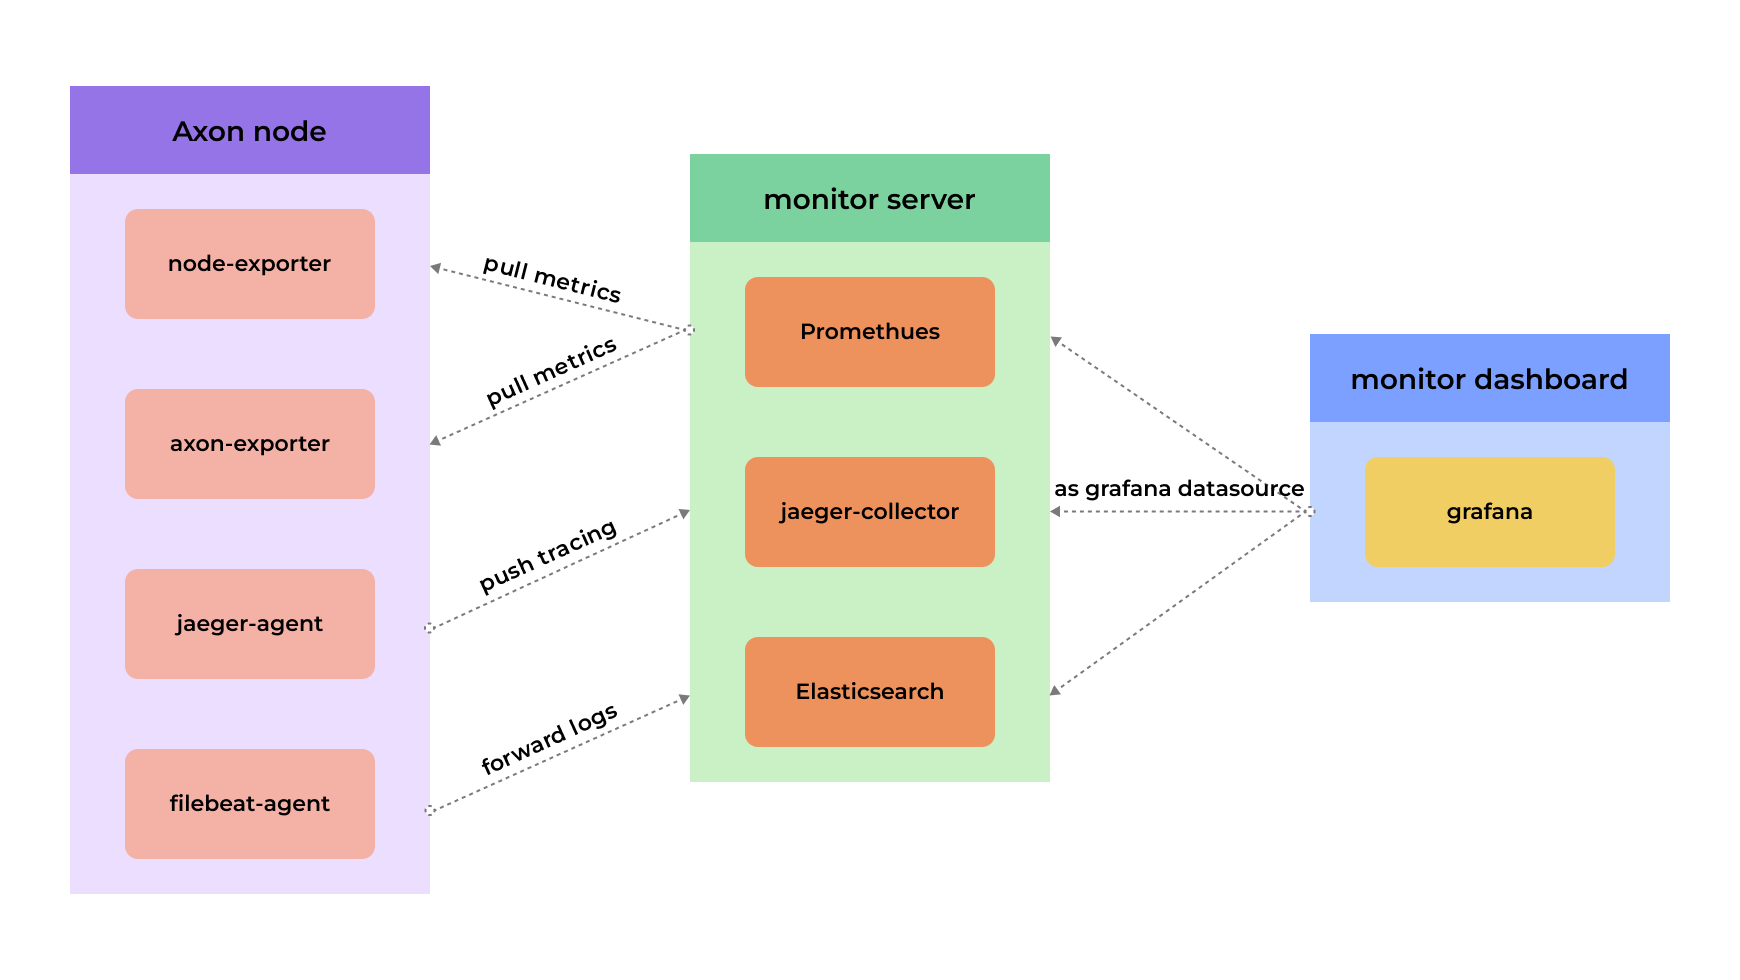
Figure 1. Overall design of Axon’s monitoring platform
Agent (Axon node)
Agent, or Axon node, is for collecting monitoring metrics and interacting with the monitor server.
- node-exporter: mainly collects system resource usage data from the target and converts it into a format supported by Prometheus located in the monitor server. Prometheus periodically scrapes metrics from the node exporter. This data will be visualized in Grafana.
- axon-exporter: mainly collects Axon’s metrics, which will be periodically scraped by Promethues and eventually be visualized in Grafana.
- jaeger-agent: listens and collects the traces data exposed by Axon and forwards them to the configured jaeger-collector.
- filebeat-agent: a lightweight shipper that collects, centralizes, and forwards log data to elasticsearch, a distributed search and analytics engine.
Monitor Server
Monitor server is mainly for displaying the data of metrics and traces.
- prometheus: collects Axon metrics which will be displayed as a datasource in Grafana.
- jaeger-collector: receives data pushed by jaeger-agent which will be displayed as a datasource in Grafana.
- elasticsearch: collects and stores Axon‘s logs, which will be displayed as a datasource in Grafana. Elasticsearch filters error logs and sends alerts through ES-alert (the alerting for Elasticsearch) in accordance with previously defined rules. (Please be aware that Elasticsearch may consume a lot of machine memory.)
Monitor Dashboard
- Grafana: uses Promethues, jaeger, and elasticsearch as datasources and displays data in dashboard, monitors, and logs.
Deploy Monitor and Monitor Agent
Axon application performance monitoring (apm) supports one-click deployment of monitor and monitor agent.
Monitor Deployment
Step 1 Copy axon-devops to the target machine.
git clone https://github.com/axonweb3/axon-devops
cd axon-devops/apm/monitor
Step 2 Edit prometheus.yml and roles/monitor/vars/main.yml.
prometheus.yml: contains Prometheus configuration files.
scrape_config, one of these files, specifies a set of targets and parameters describing how to scrape them. In the general case, one scrape configuration specifies a single job.
Below are a few scrape_config parameters set in Axon, and more configuration information is available here:
global:

  scrape_interval:     5s
 # Scrape targets from a job every 15s. Default = 1m.

 evaluation_interval: 5s
 # Evaluate rules every 15s. Default = 1m.

 scrape_timeout:      5s
 # Set to the global default (10s).
roles/monitor/vars/main.yml: mainly used as the parameters required by Ansible when deploying the monitor.
monitor_dir: /home/ckb/axon-monitor
Step 3 Execute monitor deployment command.
cd axon-devops/apm/deploy
make monitor-clean # Stop monitor service(History data will be cleared. Use carefully)
make monitor-deploy # Start monitor service
docker-compose ps # Check if service is seccessfully started.
Monitor Agent Deployment
Step 1 Copy axon-devops directory to the target machine
git clone https://github.com/axonweb3/axon-devops
cd axon-devops/apm/agent
Step 2 Edit config files.
.env: sets environment variables that are used when running thedocker-compose.yml
JAEGER_COLLECTOR_IP=jaeger-collector:14250
# Used to push data to the jaeger server.
# Configure the ip port for jaeger-collector.
# Corresponds to the jaeger-collector service in monitor docker-compose.

JAEGER_AGENT_PORT=6831
# Used to interact with Axon.
# Associated with the [apm] tracing_address parameter.

AXON_LOG_PATH=axon/logs
# Used to collect logs for filebeat.
# Associated with the [logger] log_path parameter.
jaeger_agent_port config file is here.
filebeat.yml: used to build structured configurations for lists and dictionaries
filebeat.inputs:

- type: log
  enabled: true
  paths:
    - '/usr/share/filebeat/logs/*log'
  # Filebeat collects files in /usr/share/filebeat/logs/ that end in .log

  fields_under_root: true
  # Custom fields will be stored as top-level fields in the output file

 keys_under_root: true
  # The existing keys are overwritten by keys in decoded JSON obejct

 ignore_older: 5m
  # Filebeat will ingore files modified before the specified time span

 scan_frequency: 1s
  # How frequently Filebeat checks new files in the path specified for files collection

 output.elasticsearch:
  # filebeat sends logs to elasticsearch

 hosts: ["ES_ADDRESS:9200"]
   # elasticsearch host

 indices:
    - index: "axon-%{[agent.version]}-%{+yyyy.MM.dd}"
   # Index for creating datasource in Grafaba. Logs can be located with axon-*
axon-devops/apm/deploy/roles/agent/vars/main.yaml
monitor_agent_dir: /home/ckb/axon-apm-agent
# Copy the command to the target file storage section

log_path: \/home\/ckb\/axon\/logs
# Axon's Logs directory. Must be identical with Axon deployment directory.

es_address: XXX.XX.XX.XX
# Intranet of the ip address deployed by elasticsearch.
- axon-devops/apm/deploy/hosts
# Configure monitor agent deployment

[axon_node]
# Monitor agent deployment follows axon agent. Here axon node ip must be specified.
XXX.XXX.XXX.XXX

[prometheus_server]
# prometheus_server
xxx.xxx.xxx.xxx

[allhost:children]
axon_node
prometheus_server
Step 3 Execute Monitor Agent deployment command
cd axon-devops/apm/deploy
make clean
# Clear axon monitor agent

make deploy
# Deploy axon monitor agent

docker-compose ps
# Check if service is successfully started.
View Monitoring Platform
When all services are up, you can access the corresponding monitoring platforms through the browser by the following address:
- Grafana
http://grafana_ip:3000
- Jaeger
http://jarger_ip:16686
Deploy High Availability Monitoring
High Availability (HA) monitoring is also supported. However, due to the high cost of operation and maintenance, Axon does not use HA but a single-node deployment (as explained in Section II) instead.
If your monitoring platform is suitable for HA, you can refer to the following tutorials:
- Grafana: Set up Grafana for high availability
- Promethues: Federation HA mode
- Promethues: Storage HA mode
- Elasticsearch: Multi-node cluster HA mode
- Multi-node Elasticsearch cluster
- For retention requirements, refer to the index-lifecycle-management section in the documentation.
- Jaeger HA mode
- Jaeger components can exist independently and communicate via RPC. It is recommended to deploy multiple jaeger-collectors for collecting in HA mode.
- It is recommended to deploy multiple jaeger-query nodes as well and add Nginx for query in HA mode.
- Data can be cleaned up periodically in accordance with the storage. Take Elasticsearch as an example, to perform a deletion you can refer to the Delete by Query API tutorial or the official Curator Project
Monitoring Metrics Explained
This section provides an overview of the monitoring metrics on each Grafana panel.
Axon-node
Recource Overview
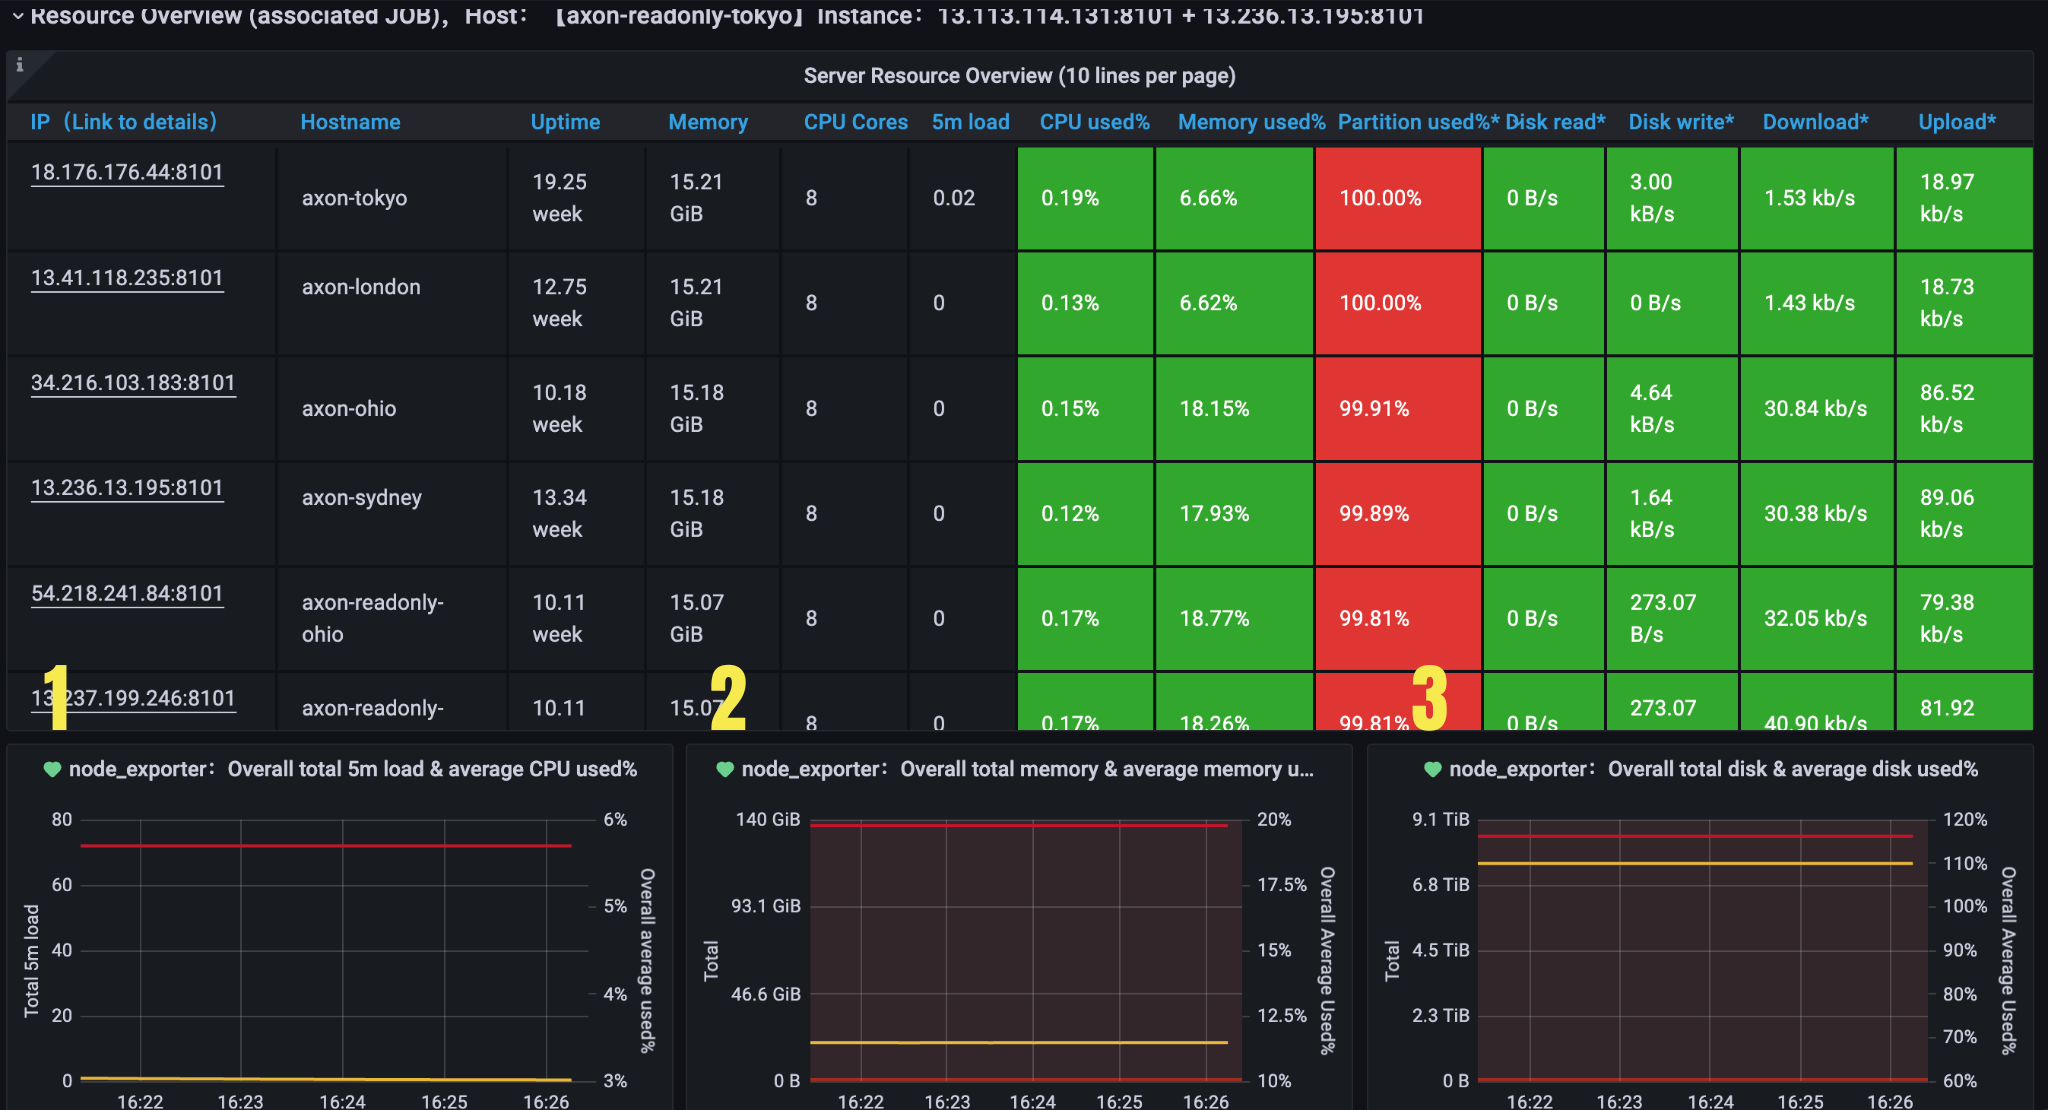
Figure 2. Server Resource Overview
| Metrics Brower | Type | Description | Legend Details | |
|---|---|---|---|---|
| 1 | Overall total 5m load & average CPU used | CPU | Monitor overall cpu usage | CPU Cores Number of cores for all CPUs count(node_cpu_seconds_total{job=~"node_exporter", mode='system'}) |
Total 5m load Load5 for all CPUs sum(node_load5{job=~"node_exporter"}) | ||||
Overall average used% Average utilization of all CPUs avg(1 - avg(irate(node_cpu_seconds_total{job=~"node_exporter",mode="idle"}[5m])) by (instance)) * 100 | ||||
Load5 Avg Load5 Avg for all CPUs sum(node_load5{job=~"node_exporter"}) / count(node_cpu_seconds_total{job=~"node_exporter", mode='system'}) | ||||
| 2 | Overall total memory & average memory used | Disk | Monitor overall disk usage | Total Total memory sum(node_memory_MemTotal_bytes{job=~"node_exporter"}) |
Total Used Overall used memory sum(node_memory_MemTotal_bytes{job=~"node_exporter"} - node_memory_MemAvailable_bytes{job=~"node_exporter"}) | ||||
Total Average Used Utilization of all memory (sum(node_memory_MemTotal_bytes{job=~"node_exporter"} - node_memory_MemAvailable_bytes{job=~"node_exporter"}) / sum(node_memory_MemTotal_bytes{job=~"node_exporter"}))*100 | ||||
| 3 | Overall total disk & average disk used% | Disk | Monitor overall disk usage | Total Total memory sum(avg(node_filesystem_size_bytes{job=\~"node_exporter",fstype=\~"xfs\|ext.*"})by(device,instance)) |
Total Used Overall used disk sum(avg(node_filesystem_size_bytes{job=\~"node_exporter",fstype=\~"xfs\|ext.*"})by(device,instance)) -sum(avg(node_filesystem_free_bytes{job=\~"node_exporter",fstype=\~"xfs\|ext.*"})by(device,instance)) | ||||
Total Average Used% Utilization of all disk (sum(avg(node_filesystem_size_bytes{job=\~"node_exporter",fstype=\~"xfs\|ext.*"})by(device,instance)) - sum(avg(node_filesystem_free_bytes{job=\~"node_exporter",fstype=\~"xfs\|ext.*"})by(device,instance))) *100/(sum(avg(node_filesystem_avail_bytes{job=\~"node_exporter",fstype=\~"xfs\|ext.*"})by(device,instance))+(sum(avg(node_filesystem_size_bytes{job=\~"node_exporter",fstype=\~"xfs\|ext.*"})by(device,instance)) - sum(avg(node_filesystem_free_bytes{job=\~"node_exporter",fstype=\~"xfs\|ext.*"})by(device,instance)))) |
Resource Details
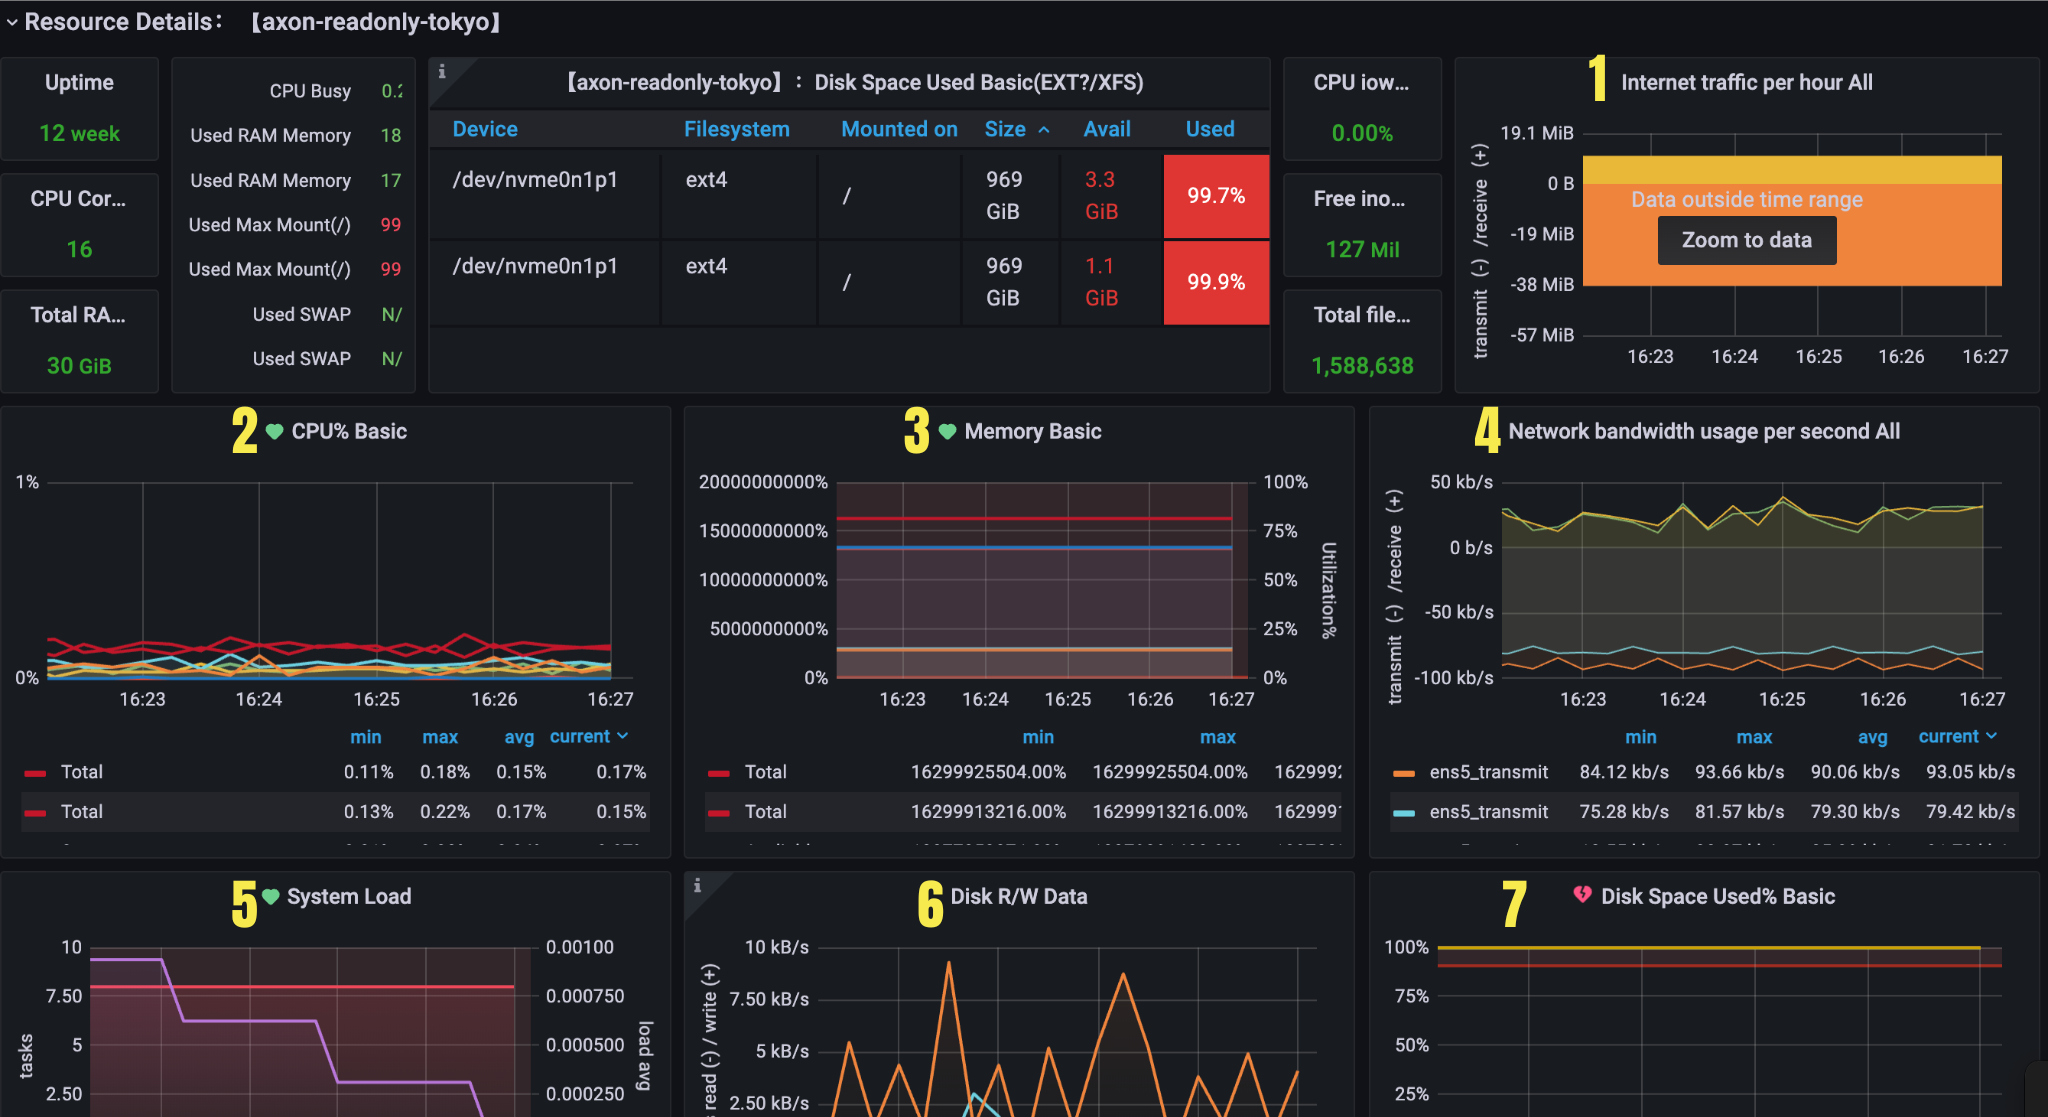
Figure 3. Resource details
| Name | Type | Description | Legend Details | |
|---|---|---|---|---|
| 1 | Internet traffic per hour | Network | Traffic statistics | Receive Receive statistics increase(node_network_receive_bytes_total{instance=~"$node",device=~"$device"}[60m]) |
Transmit transmit statistics increase(node_network_transmit_bytes_total{instance=~"$node",device=~"$device"}[60m]) | ||||
| 2 | CPU% Basic | CPU | Traffic statistics | System Average sy ratio avg(irate(node_cpu_seconds_total{instance=~"$node",mode="system"}[5m])) by (instance) *100 |
User Average sy ratio avg(irate(node_cpu_seconds_total{instance=~"$node",mode="user"}[5m])) by (instance) *100 | ||||
Iowait Average sy ratio avg(irate(node_cpu_seconds_total{instance=~"$node",mode="iowait"}[5m])) by (instance) *100 | ||||
Total Average CPU usage (1 - avg(irate(node_cpu_seconds_total{instance=~"$node",mode="idle"}[5m])) by (instance))*100 | ||||
| 3 | Memory Basic | Memory | Node memory usage | Total Total memory node_memory_MemTotal_bytes{instance=~"$node"} |
Used Used memory node_memory_MemTotal_bytes{instance=~"$node"} - node_memory_MemAvailable_bytes{instance=~"$node"} | ||||
Available Available memory size node_memory_MemAvailable_bytes{instance=~"$node"} | ||||
Used% Utilization of all memory (1 - (node_memory_MemAvailable_bytes{instance=~"$node"} / (node_memory_MemTotal_bytes{instance=~"$node"})))* 100 | ||||
| 4 | Network bandwidth usage per second all | Network | Network bandwidth | ReceiveTotal Receive statistics per second irate(node_network_receive_bytes_total{instance=~'$node',device=~"$device"}[5m])*8 |
Transmit Transmit statistics per second irate(node_network_transmit_bytes_total{instance=~'$node',device=~"$device"}[5m])*8 | ||||
| 5 | System Load | CPU | System Load | 1m Load 1 node_load1{instance=~"$node"} |
5m Load 5 node_load5{instance=~"$node"} | ||||
15m Load 15 node_load15{instance=~"$node"} | ||||
CPU cores Number of cores for CPU sum(count(node_cpu_seconds_total{instance=~"$node", mode='system'}) by (cpu,instance)) by(instance) | ||||
Load5 Avg load5 Avg for CPU avg(node_load5{instance=~"$node"}) / count(node_cpu_seconds_total{instance=~"$node", mode='system'}) | ||||
Load5 Avg-{{instance}} Not shown, for alert sum(node_load5) by (instance) / count(node_cpu_seconds_total{job=~"node_exporter", mode='system'}) by (instance) | ||||
| 6 | Disk R/W Data | Disk | Disk thoughput | Read bytes node_load1{instance=~"$node"} |
Written bytes node_load5{instance=~"$node"} | ||||
| 7 | Disk Space Used% Basic | Disk | IOPS | Mount point Disk space utilization `(node_filesystem_size_bytes{instance=~'$node',fstype=~"ext.* |
| 8 | Disk IOps Completed (IOPS) | Disk | IOPS | Reads completed Read IOPS irate(node_disk_io_time_seconds_total{instance=~"$node"}[5m]) |
Writes completed Write IOPS irate(node_disk_io_time_seconds_total{instance=~"(.*):9100"}[5m]) | ||||
| 9 | Time Spent Doing I/Os | Disk | I/O Utilization | IO time I/O Utilization irate(node_disk_io_time_seconds_total{instance=~"$node"}[5m]) |
{{instance}}-%util Not shown, for alert irate(node_disk_io_time_seconds_total{instance=~"(.*):9100"}[5m]) | ||||
| 10 | Disk R/W Time(Reference: less than 100ms)(beta) | Disk | Average response time | Read time irate(node_disk_read_time_seconds_total{instance=~"$node"}[5m]) / irate(node_disk_reads_completed_total{instance=~"$node"}[5m]) |
Write time irate(node_disk_write_time_seconds_total{instance=~"$node"}[5m]) / irate(node_disk_writes_completed_total{instance=~"$node"}[5m]) | ||||
| 11 | Network Sockstat | Network | Socketstat | CurrEstab Number of ESTABLISHED state connections node_netstat_Tcp_CurrEstab{instance=~'$node'} |
TCP_tw status Number of time_wait state connections node_sockstat_TCP_tw{instance=~'$node'} | ||||
Sockets_used Total number of all protocol sockets used node_sockstat_sockets_used{instance=~'$node'} | ||||
UDP_inuse Number of UDP sockets in use node_sockstat_UDP_inuse{instance=~'$node'} | ||||
TCP_alloc Number of tcp sockets(ESTABLISHED, sk_buff) Number of TCP sockets(ESTABLISHED, sk_buff) | ||||
Tcp_PassiveOpens Number of passively opened tcp connections irate(node_netstat_Tcp_PassiveOpens{instance=~'$node'}[5m]) | ||||
Tcp_ActiveOpens Number of active open tcp connections irate(node_netstat_Tcp_ActiveOpens{instance=~'$node'}[5m]) | ||||
Tcp_InSegs Number of tcp messages received irate(node_netstat_Tcp_InSegs{instance=~'$node'}[5m]) | ||||
Tcp_OutSegs Number of tcp messages transmit irate(node_netstat_Tcp_OutSegs{instance=~'$node'}[5m]) | ||||
Tcp_RetransSegs Number of tcp messages retransmitted irate(node_netstat_Tcp_RetransSegs{instance=~'$node'}[5m]) | ||||
| 12 | Open File Descriptor (left)/Context switches (right) | Disk | I/O Utilization | Used filefd Number of open file fd node_filefd_allocated{instance=~"$node" |
Switches Context switches irate(node_context_switches_total{instance=~"$node"}[5m]) |
Actuator Health
| Name | Type | Description | Legend Details |
|---|---|---|---|
| Axon Status | Axon | Axon service status | active Number of Axon service in up status count(up{job="axon_exporter"} == 1) |
down Number of Axon service in down status (up{job="axon_exporter"} == 0) | |||
| Node status | Node_exporter | Node_exporter service status | active Number of Node_exporter services in up status count(up{job="node_exporter"} == 1) |
down Number of Node_exporter services in down status count(up{job="node_exporter"} == 0) | |||
| Promethues Status | Promethues | Promethues service status | active Number of Promethues services in up status count(up{job="prometheus"} == 1) |
down Number of Promethues services in down status count(up{job="prometheus"} == 0) | |||
| Jaeger status | Jaeger | Jaeger service status | jaeger-query-active Number of Jaeger-query services in up status count(up{instance=~"(.*):16687"} == 1) |
jaeger-collector-active Number of Jaeger-collector services in down status count(up{instance=~"(.*):14269"} == 1) | |||
jaeger-query-down Number of Jaeger-query services in up status count(up{instance=~"(.*):16687"} == 0) | |||
jaeger-collector-down Number of Jaeger-collector services in down status count(up{instance=~"(.*):14269"} == 0) | |||
| Jaeger Agent Status | Jaeger | Jaeger agent status | active Number of Jaeger-agent services in up status count(up{job="jaeger_agent"} == 1) |
down Number of Jaeger-agent services in down status count(up{job="jaeger_agent"} == 0) |
Axon-benchmark
Panel 1
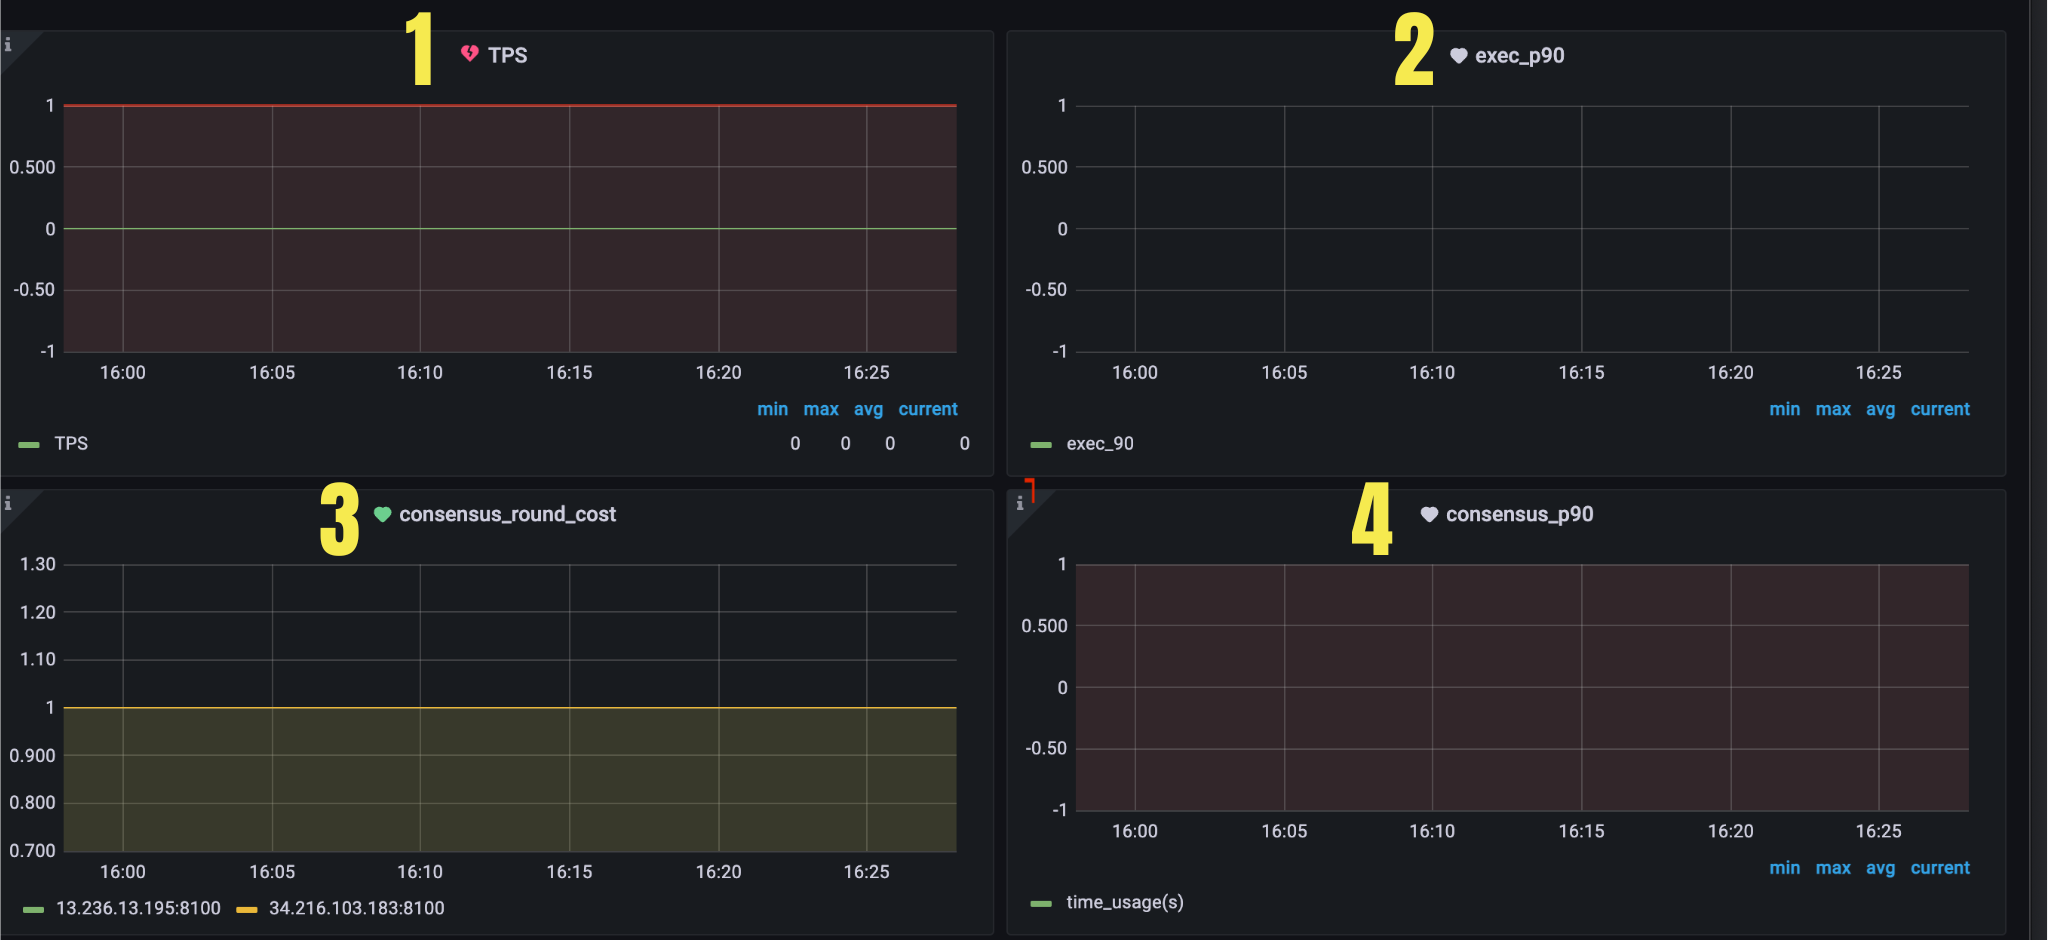
Figure 4. Panel 1
| Name | Description | Legend Details | |
|---|---|---|---|
| 1 | TPS | TPS for consensus | avg(rate(axon_consensus_committed_tx_total[5m])) |
| 2 | exec_90 | Consensus exec time for P90 | avg(histogram_quantile(0.90, sum(rate(axon_consensus_time_cost_seconds_bucket{type="exec"}[5m])) by (le, instance))) |
| 3 | consensus_round_cost | Number of rounds needed to reach consensus | {{instance}} Number of rounds needed to reach consensus (axon_consensus_round > 0 ) |
| 4 | consensus_90 | Consensus time for P90 | time_usage(s) Consensus time for P90 avg(histogram_quantile(0.90, sum(rate(axon_consensus_duration_seconds_bucket[5m])) by (le, instance))) |
Panel 2
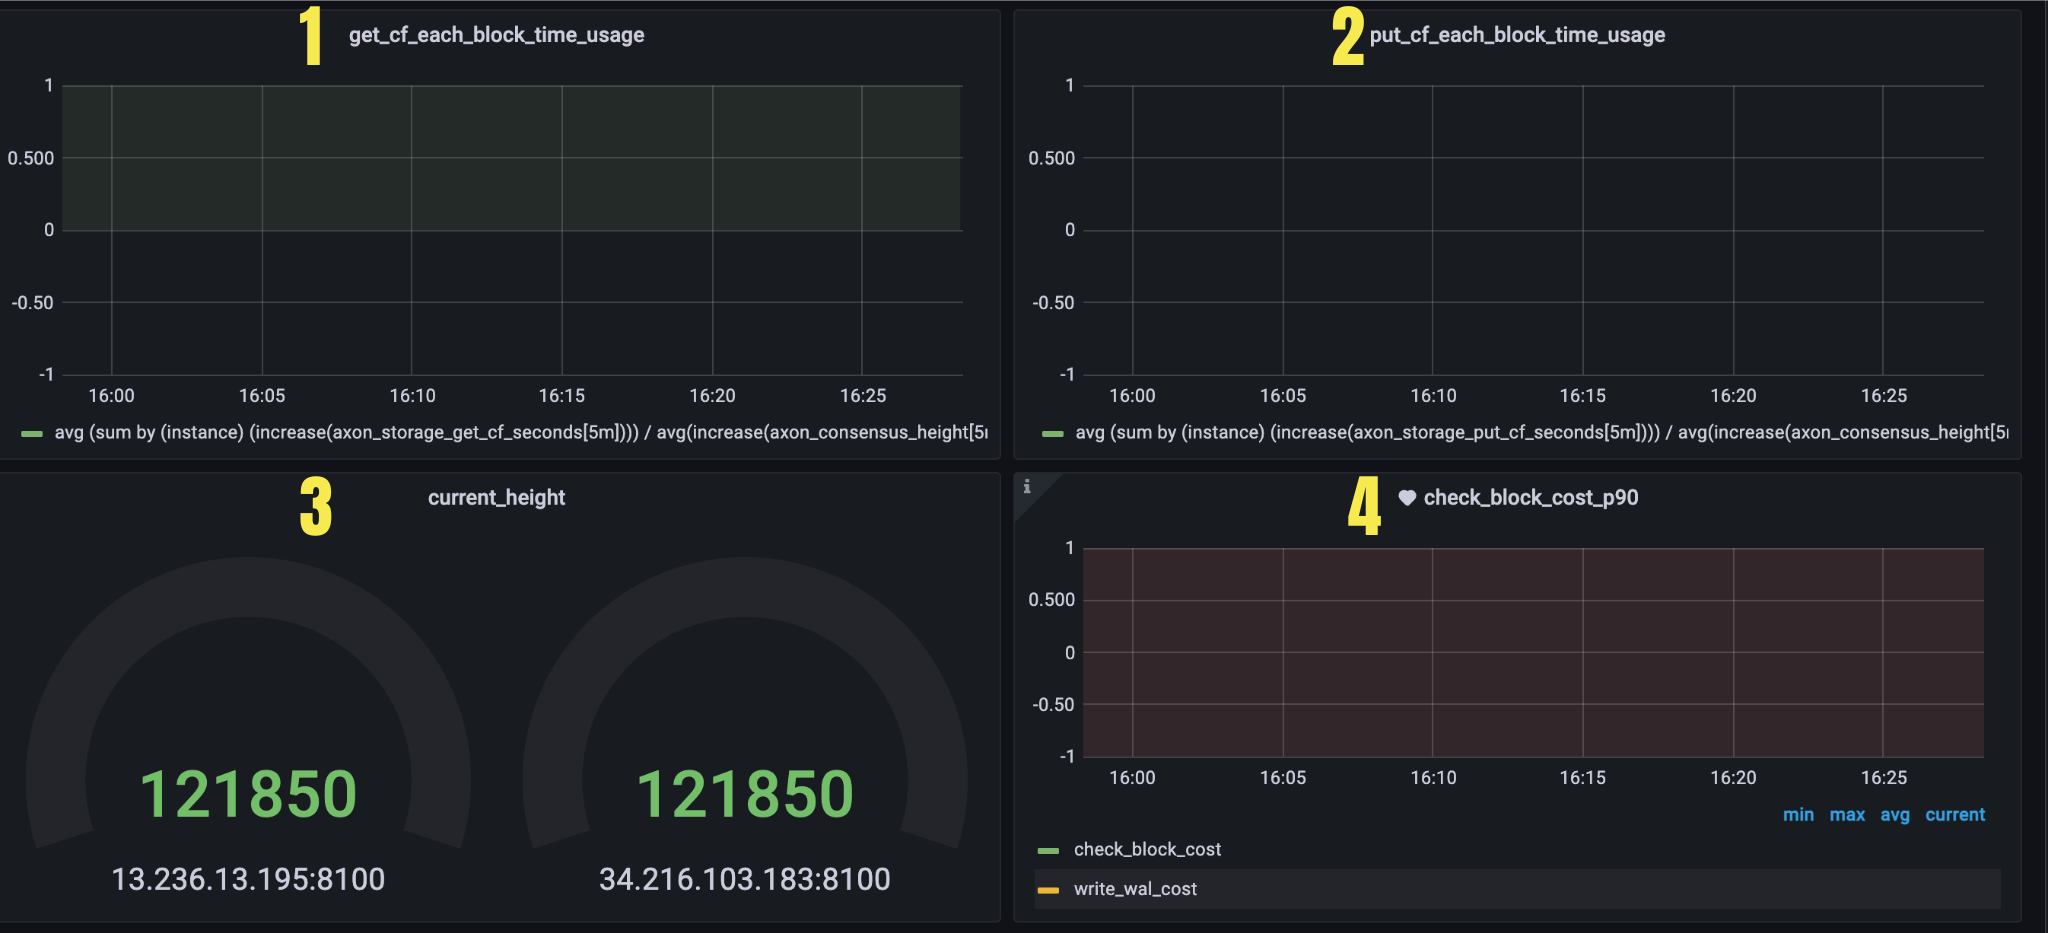
Figure 5. Panel 2
| Name | Description | Legend Details | |
|---|---|---|---|
| 1 | get_cf_each_block_time_usage | Average time per block for rocksdb running get_cf | Average time per block for rocksdb running get_cf avg (sum by (instance) (increase(axon_storage_get_cf_seconds[5m]))) / avg(increase(axon_consensus_height[5m])) |
| 2 | put_cf_each_block_time_usage | Average time per block for rocksdb running put_cf | Average time per block for rocksdb running put_cf avg (sum by (instance) (increase(axon_storage_put_cf_seconds[5m]))) / avg(increase(axon_consensus_height[5m])) |
| 3 | current_height | Chain current height | {{instance}} Node current height sort_desc(axon_consensus_height) |
| 4 | check_block_cost_p90 | check block exec time for P90 | Check block exec time for P90 avg(histogram_quantile(0.90, sum(rate(axon_consensus_check_block_bucket{type="get_txs_cost"}[5m])) by (le, instance))) |
Panel 3
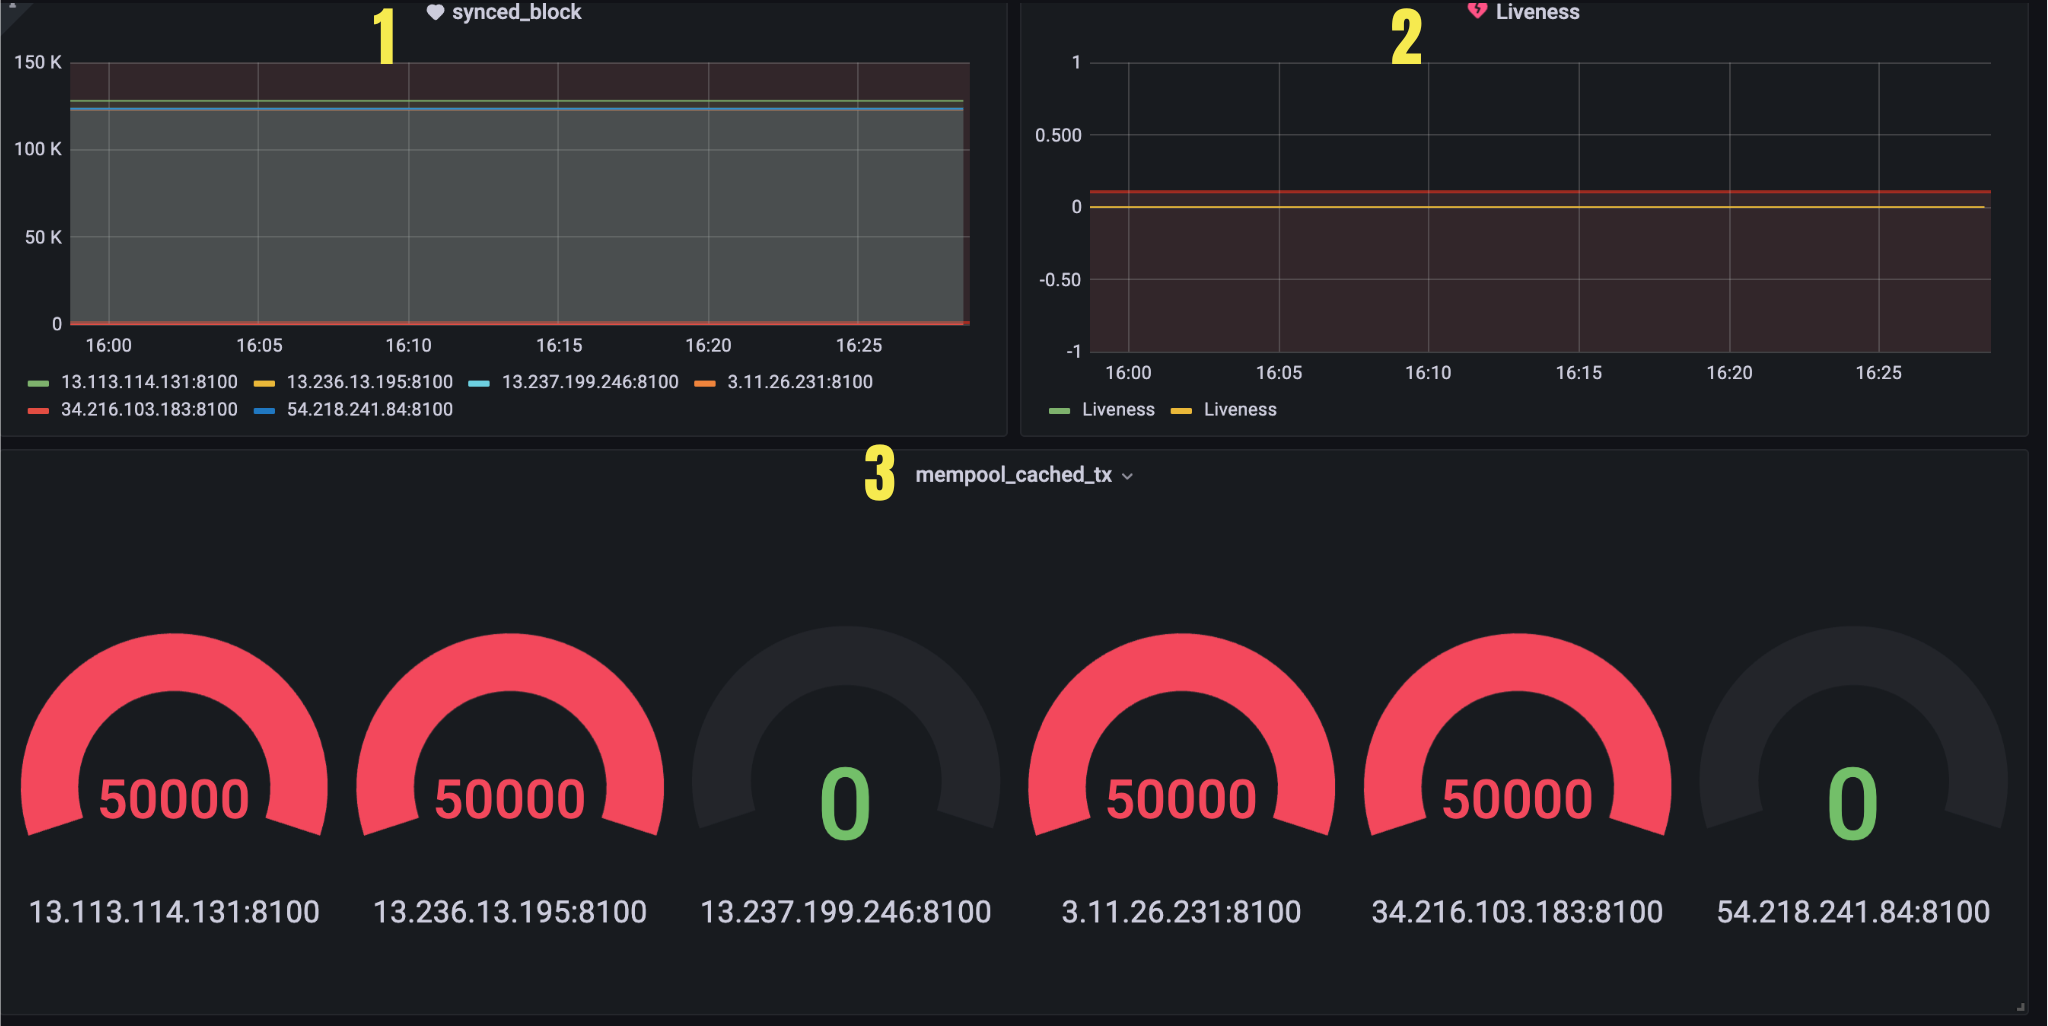
Figure 6. Panel 3
| Name | Description | Legend Details | |
|---|---|---|---|
| 1 | synced_block | Number of blocks synchronized by nodes | {{instance}} Number of blocks synchronized by nodes axon_consensus_sync_block_total |
| 2 | liveness | Liveness | Growth in node height increase(axon_consensus_height{job="axon_exporter"}[1m]) |
| 3 | mempool_cached_tx | Number of transactions in the current mempool | {{instance}} Number of transactions in the current mempool axon_mempool_tx_count |
Panel 4
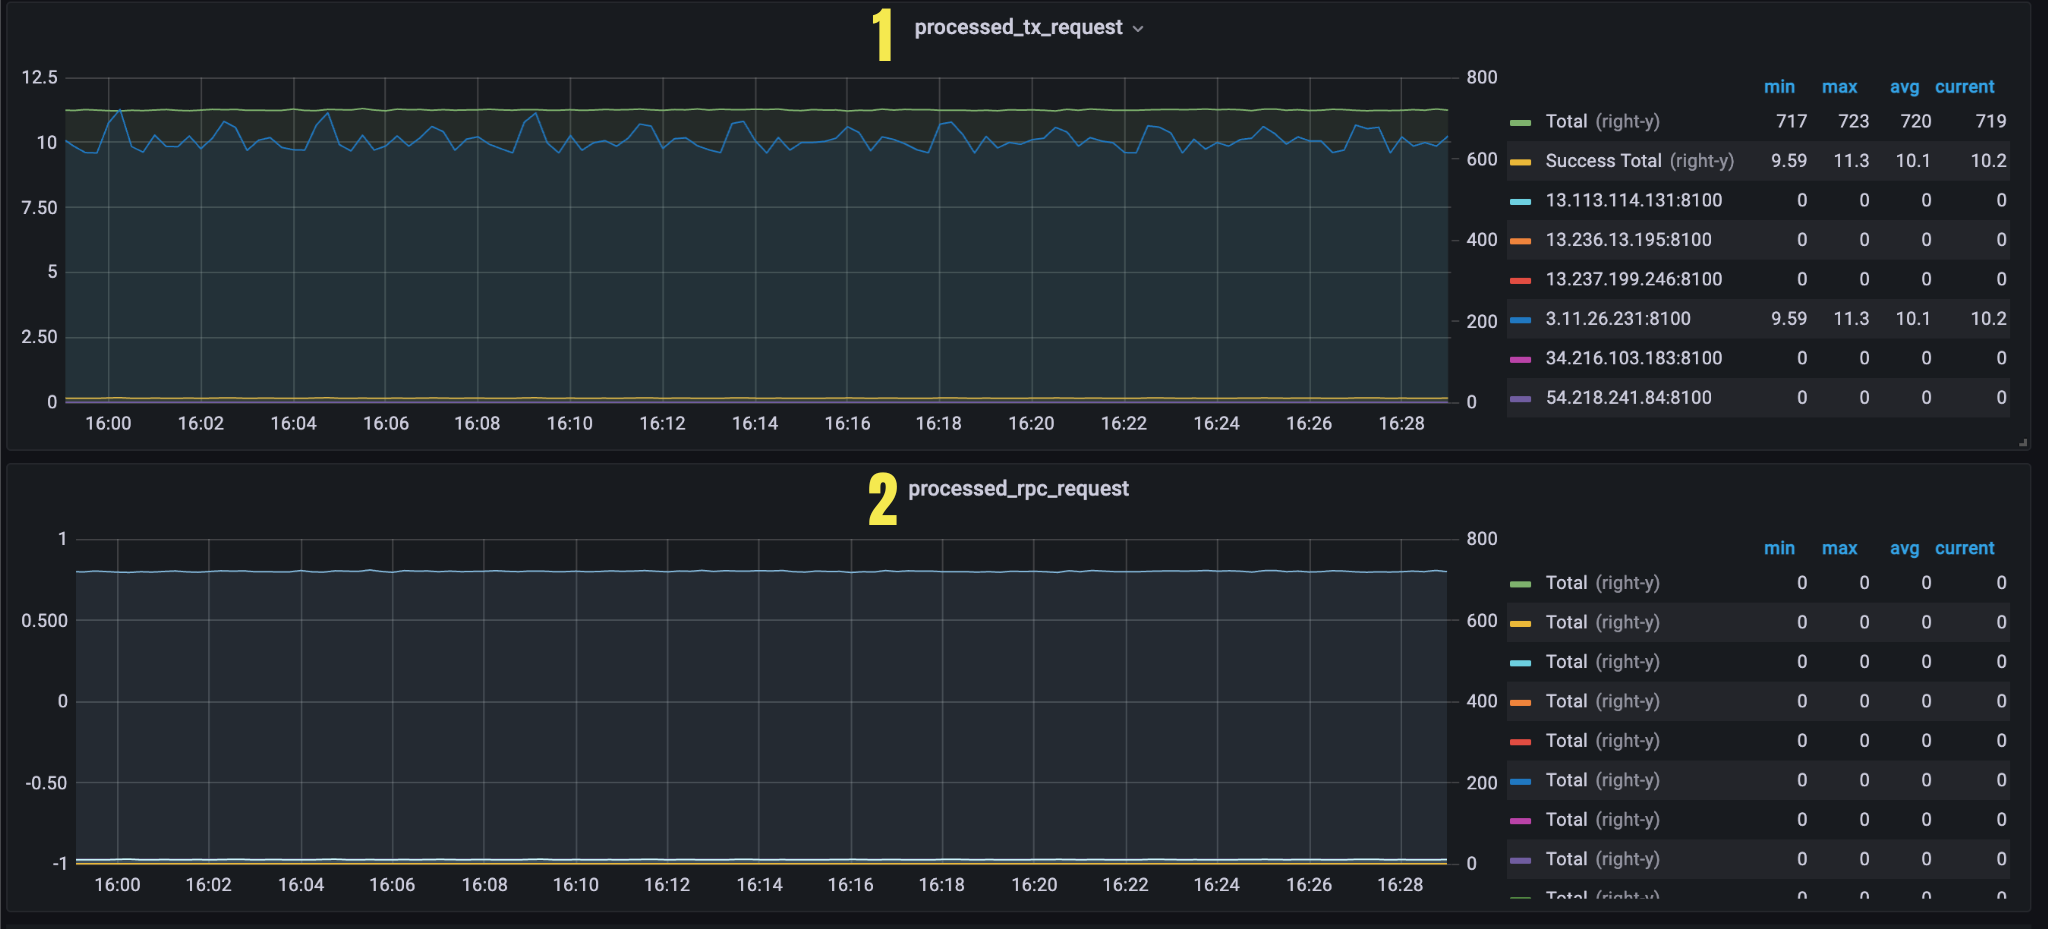
Figure 7. Panel 4
| Name | Description | Legend Details | |
|---|---|---|---|
| 1 | processed_tx_request | received transaction request count in last 5 minutes (the unit is count/second) | Total Total number of transaction requests sum(rate(axon_api_request_result_total{type="send_transaction"}[5m])) |
Success Total Total number of successful transaction requests sum(rate(axon_api_request_result_total{result="success",type="send_transaction"}[5m])) | |||
instance processed transaction request count in last 5 minutes (the unit is count/second) rate(axon_api_request_result_total{result="success", type="send_transaction"}[5m]) | |||
| 2 | processed_rpc_request | Estimate total number of of successful API request in last five minutes | Success Total Total number of successful API requests sum(rate(axon_api_request_result_total{result="success"}[5m])) by (type) |
Other Items
| Name | Description | Legend Details |
|---|---|---|
| network_message_arrival_rate | Estimate the network message arrival rate in the last five minutes | Estimate the network message arrival rate in the last five minutes ( # broadcast_count * (instance_count - 1) sum(increase(axon_network_message_total{target="all", direction="sent"}[5m])) * (count(count by (instance) (axon_network_message_total)) - 1) # unicast_count + sum(increase(axon_network_message_total{target="single", direction="sent"}[5m]))) /# received_count(sum(increase(axon_network_message_total{direction="received"}[5m]))) |
| consensus_round_cost | Number of rounds needed to reach consensus | {{instance}} Number of rounds needed to reach consensus (axon_consensus_round > 0 ) |
| Connected Peers(Gauge) | Number of nodes on the current connection | {{instance}} Number of nodes on the current connection axon_network_connected_peers |
| Connected Peers(Graph) | Number of nodes on the current connection | Saved peers Total number of peers max(axon_network_saved_peer_count) |
Connected Peers Number of nodes on the current connection axon_network_connected_peers | ||
| Consensus Peers(Gauge) | Number of consensus nodes | {{instance}} Number of consensus nodes axon_network_tagged_consensus_peers |
| Consensus Peers(Graph) | Number of consensus nodes | Consensus peers Total number of consensus peers max(axon_network_tagged_consensus_peers) |
{{instance}}-Connected Consensus Peers (Minus itself) Number of consensus nodes axon_network_connected_consensus_peers | ||
| Saved peers | Number of nodes saved peers | {{instance}} Number of nodes saved peers axon_network_saved_peer_count |
| Unidentified Connections | The number of connections in the handshake, requiring verification of the chain | {{instance}} The number of connections in the handshake, requiring verification of the chain id axon_networ_unidentified_connections |
| Connecting Peers | Number of active initiations to establish connections with other | {{instance}} Number of active initiations to establish connections with other machines axon_network_outbound_connecting_peers |
| Disconnected count (To other peers) | Disconnected count | {{instance}} Disconnected count axon_network_ip_disconnected_count |
| Received messages in processing | Number of messages being processed | {{instance}} Number of messages being processed axon_network_received_message_in_processing_guage |
| Received messages in processing by ip | Number of messages being processed (based on IP of received messages) | {{instance}} Number of messages being processed (based on IP of received messages) axon_network_received_ip_message_in_processing_guage{instance=~"$node"} |
| Ping (ms)_ p90 | p90 for p2p Ping | {{instance}} p90 for P2p Ping avg(histogram_quantile(0.90, sum(rate(axon_network_ping_in_ms_bucket[5m])) by (le, instance))) |
| Network bandwidth usage per second all | link to axon-node (Network bandwidth usage per second all) | link to axon-node (Network bandwidth usage per second all) |
| Internet traffic per hour | link to axon-node (Internet traffic per hour) | link axon-benchmark (internet traffic per hour) |
| mempool_cached_tx | link axon-benchmark (mempool_cached_tx) | link axon-benchmark (mempool_cached_tx) |
| consensus_round_cost | link axon-benchmark (consensus_round_cost) | link axon-benchmark (consensus_round_cost) |